
OEE Software and Production Tracking: What Your ERP Misses
Quick Answer
OEE multiplies availability, performance and quality into one figure. Plants often quote availability alone and call it 90 percent, when real OEE is closer to the 60 percent Vorne reports as typical for discrete manufacturers. Your ERP cannot produce the number because it records plans and bookings, not micro-stoppages, so OEE software has to read the machines directly. By Mr. Sumeet Katariya, CEO, Accucia Softwares Pvt. Ltd.
Ask a plant manager for last month's OEE and you will often get a number assembled from three spreadsheets and one person's memory.
The machines knew the real answer the whole time. Nobody was writing it down.
That is the gap between what your ERP records and what your shop floor actually did. It is a data problem before it is a software problem. Get the capture right on one line, and the rest becomes ordinary integration work. Pasted text
How OEE Breaks Down, With a Worked Example
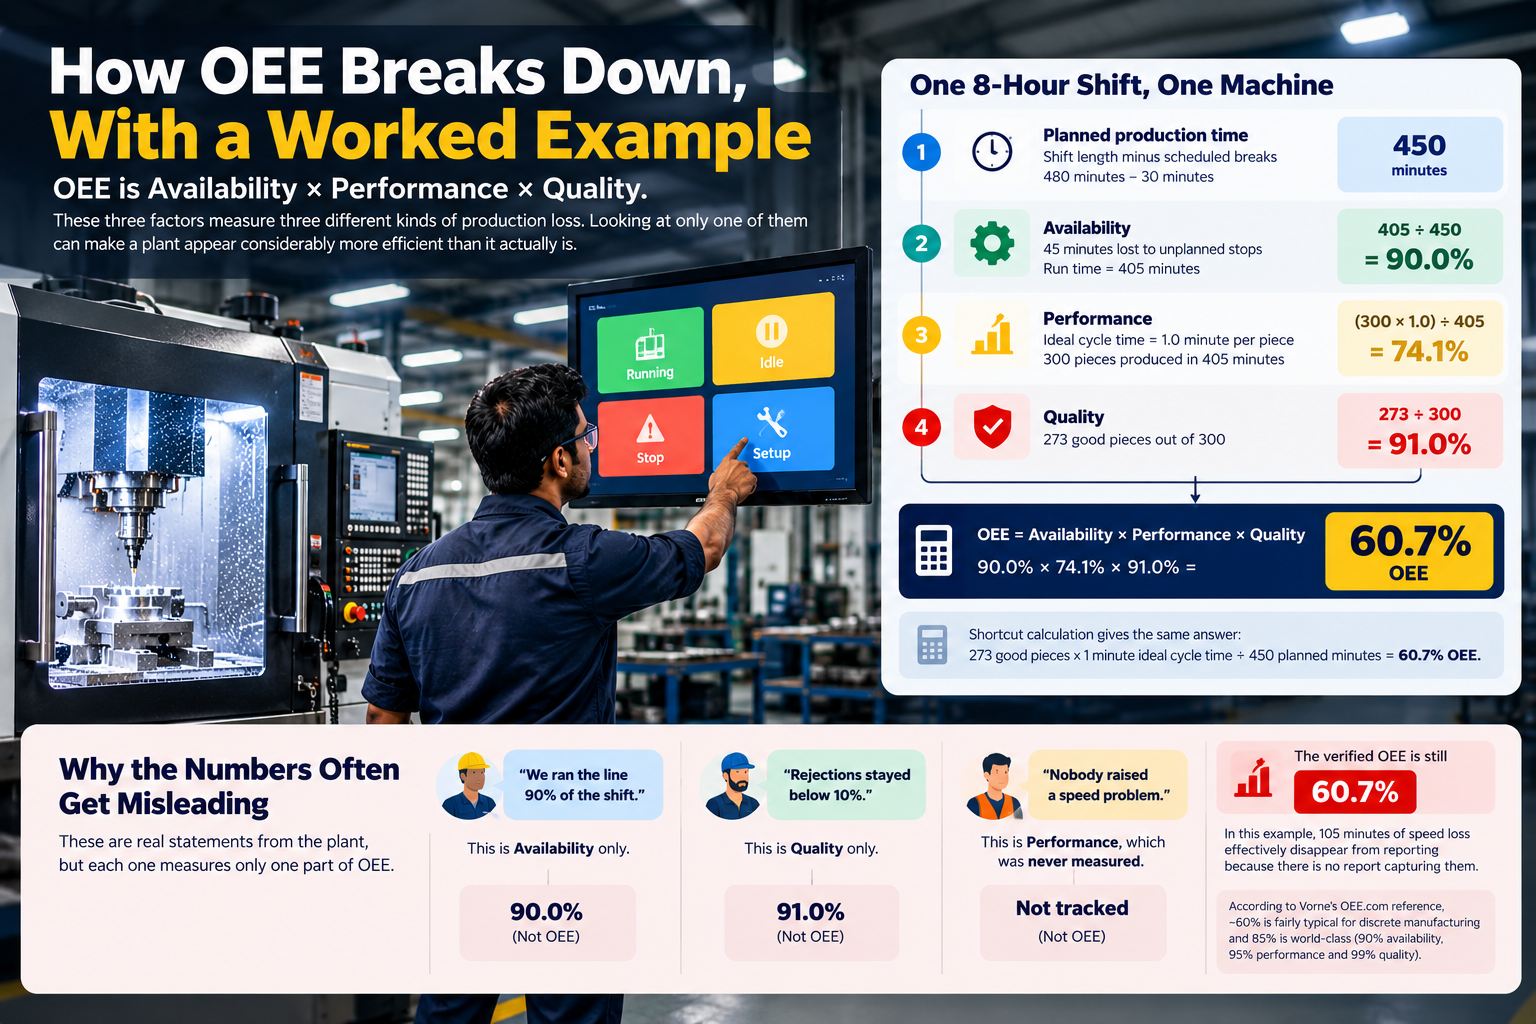
OEE is Availability × Performance × Quality.
These three factors measure three different kinds of production loss. Looking at only one of them can make a plant appear considerably more efficient than it actually is. Pasted text
Consider one eight-hour shift on a single machine.
The shift runs for 480 minutes. After removing 30 minutes of scheduled breaks, planned production time is 450 minutes.
The machine then loses 45 minutes to unplanned stops, leaving 405 minutes of run time. Availability is therefore:
405 ÷ 450 = 90.0% Availability
The ideal cycle time is one minute per piece. During those 405 minutes, the machine produces 300 pieces.
300 × 1.0 ÷ 405 = 74.1% Performance
Of those 300 pieces, 273 are good.
273 ÷ 300 = 91.0% Quality
Multiply all three:
90.0% × 74.1% × 91.0% = 60.7% OEE
The shortcut produces the same answer:
273 good pieces × 1 minute ideal cycle time ÷ 450 planned minutes = 60.7% OEE. Pasted text
Now comes the part that usually creates the argument.
The plant might say, “We ran the line 90% of the shift.” That is measuring availability, not OEE.
It might say, “Rejections stayed below 10%.” That gives you 91% quality, not OEE.
Or nobody may report a speed problem at all because performance was never measured.
The verified OEE is still 60.7%.
In this example, 105 minutes of speed loss effectively disappear from reporting because there is no report capturing them. The source also cites Vorne's OEE.com reference, which describes around 60% as fairly typical for discrete manufacturing and 85% as world-class, based on 90% availability, 95% performance and 99% quality. Pasted text
Why Your ERP Does Not Have This Data
Your ERP is doing its job. It was simply never designed to see every event happening at the machine.
ERP records intent and outcome.
It knows the work order. It knows which material was issued. It knows the quantity confirmed and the labour hours booked.
What it normally cannot see is the four-minute jam at 11:40 AM.
It does not automatically know that a spindle operated at three-quarters of its rated speed for an afternoon, that a planned 20-minute changeover took 55 minutes, or why a machine stopped when there was nowhere for the operator to record a reason.
ISA-95, published internationally as IEC 62264, helps explain the gap. ERP operates at Level 4 for business planning and logistics. Sensors and PLCs sit at Levels 1 and 2. Manufacturing operations management—the layer where OEE belongs—is Level 3.
Many mid-market plants have working systems at the ERP level and machine-control level, but little connecting the two.
The production number you actually want is generated in that gap. Pasted text
What You Actually Have to Capture, in Order of Value
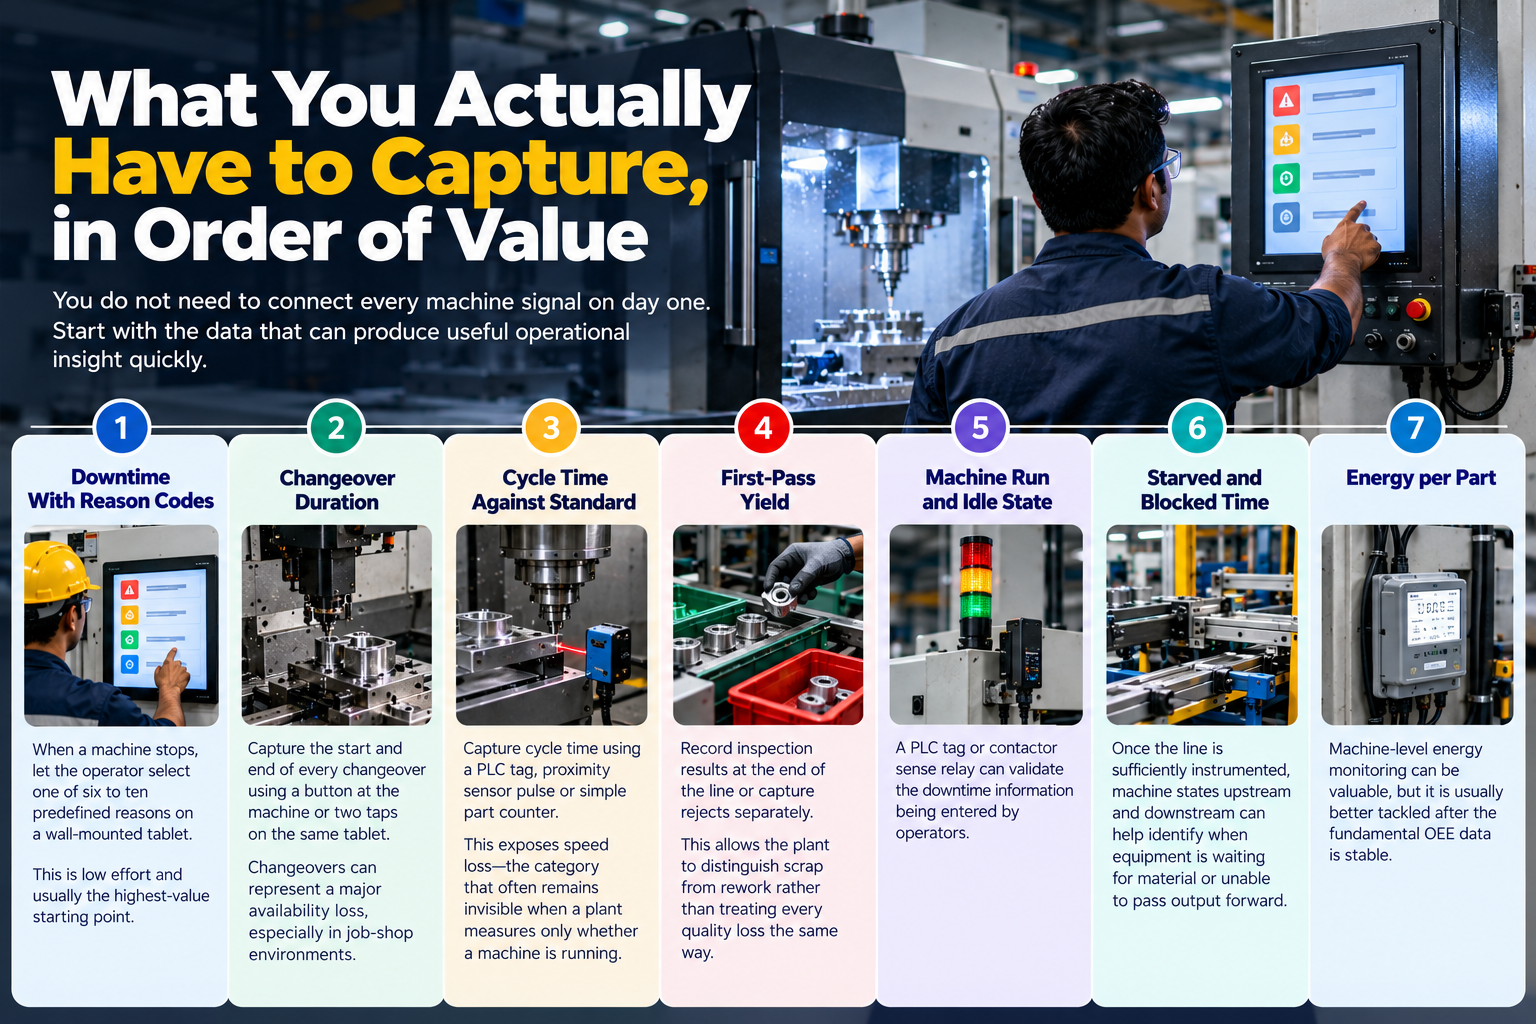
You do not need to connect every machine signal on day one.
Start with the data that can produce useful operational insight quickly.
1. Downtime With Reason Codes
When a machine stops, let the operator select one of six to ten predefined reasons on a wall-mounted tablet.
This is low effort and, according to the source material, usually the highest-value starting point. Pasted text
2. Changeover Duration
Capture the start and end of every changeover using a button at the machine or two taps on the same tablet.
In job-shop environments, changeovers can represent a major availability loss.
3. Cycle Time Against Standard
Capture cycle time using a PLC tag, proximity sensor pulse or simple part counter.
This exposes speed loss—the category that often remains invisible when a plant measures only whether a machine is running.
4. First-Pass Yield
Record inspection results at the end of the line or capture rejects separately.
This allows the plant to distinguish scrap from rework rather than treating every quality loss the same way.
5. Machine Run and Idle State
A PLC tag or contactor sense relay can validate the downtime information being entered by operators.
6. Starved and Blocked Time
Once the line is sufficiently instrumented, machine states upstream and downstream can help identify when equipment is waiting for material or unable to pass output forward.
7. Energy per Part
Machine-level energy monitoring can be valuable, but it is usually better tackled after the fundamental OEE data is stable.
The important point is that the two highest-value starting points do not necessarily require a complex integration project.
A tablet, a useful reason-code list and operators who understand why the information matters can create value before a six-month automation project reaches production. Pasted text
Choosing OEE Software Without Buying a Full MES
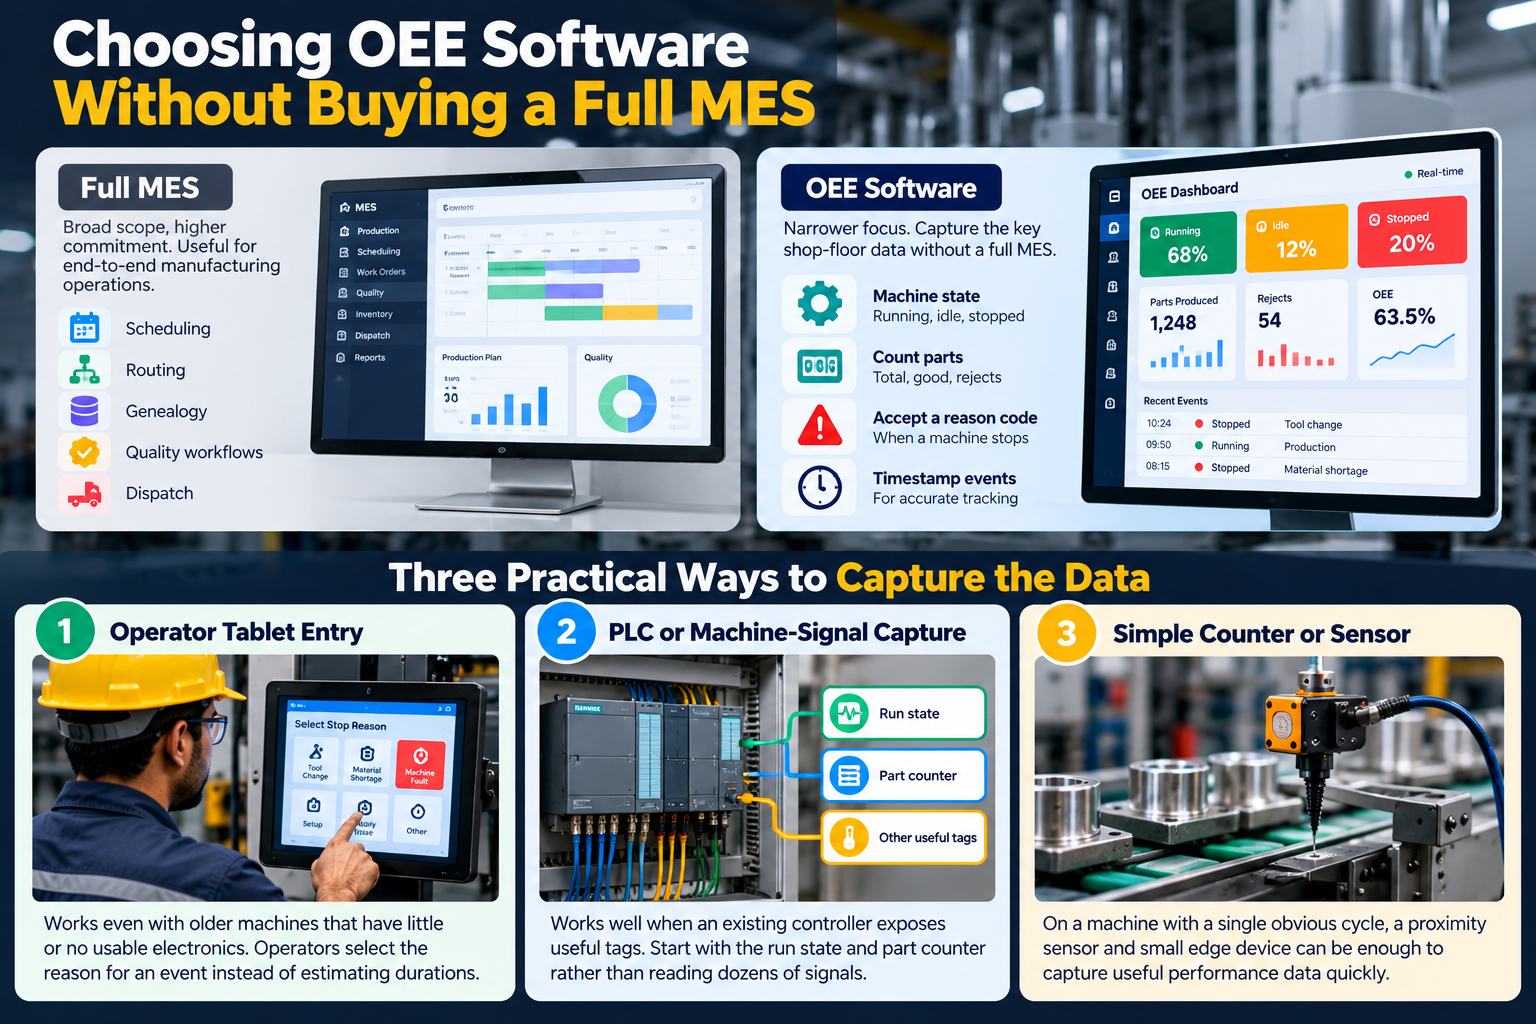
An MES can manage scheduling, routing, genealogy, quality workflows and dispatch.
That is a substantial commitment, and while it may eventually be the correct solution for some plants, it does not have to be the first step.
OEE software has a narrower job.
It needs to know the machine state, count parts and rejects, accept a reason code, and timestamp those events. Pasted text
There are three practical ways to capture that information.
Operator tablet entry works even with older machines that have little or no usable electronics. Operators should ideally enter the reason for an event rather than manually estimating durations they did not measure.
PLC or machine-signal capture works well when an existing controller exposes useful tags. Start with the run state and part counter rather than reading dozens of signals simply because they are available.
A simple counter or sensor can sometimes outperform a costly integration project. On a machine with a single obvious cycle, a proximity sensor and small edge device may be enough to produce useful performance data quickly. Pasted text
The Honest Sequence: One Line, One Shift
Do not start with the entire factory.
Start with one line and one shift.
In week one, wire the counter and agree on the downtime reason-code list with the operators who will actually use it.
During weeks two and three, run the system and allow people to challenge the numbers. That disagreement is useful because it exposes unclear definitions.
During weeks four to six, look at the reason codes accumulating too much downtime and split or refine them where necessary.
Only after the definitions become stable should you think seriously about rolling the system out across additional lines or shifts. Pasted text
A plant-wide rollout built on unstable definitions can produce a beautiful dashboard that nobody on the shop floor trusts.
Once employees decide the data is fiction, rebuilding confidence can be much harder than implementing the software itself.
Feed the Data Back Into the ERP, Not Into a Second Island
The objective of shop-floor data collection should not simply be another dashboard.
The objective is a better ERP.
Keep detailed event capture close to the machines, then push agreed summaries back into the ERP on a schedule.
That can include confirmed good quantity against the work order, scrap by reason, downtime by reason, and actual changeover duration compared with the routing.
What you should avoid is allowing the OEE system to create its own item master, routing definitions or independent definition of a shift.
That creates two versions of production truth—and eventually a monthly meeting to reconcile them. Pasted text
An integration layer can handle the mapping between the shop-floor system and the ERP while keeping master data under ERP control.
For older ERP environments with limited integration options, that constraint needs to be understood before the architecture is finalised.
What Changes Once the Number Is Real
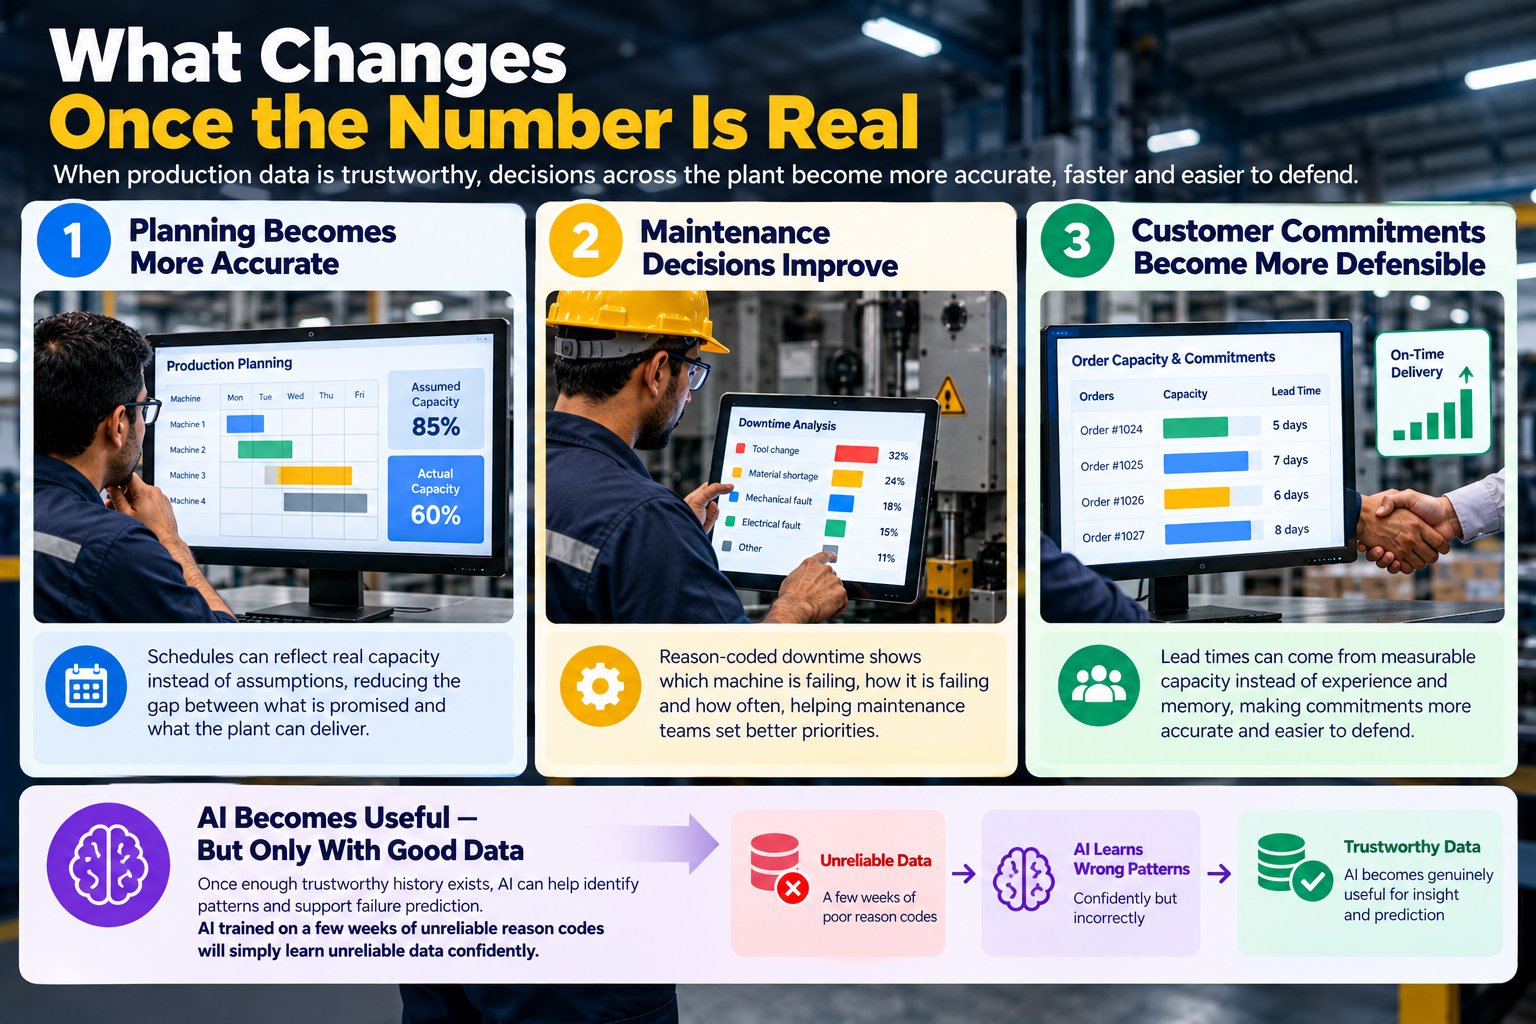
Once production data becomes trustworthy, three things tend to change.
Planning Becomes More Accurate
If a machine genuinely delivers 60% rather than the 85% assumed in planning, the schedule can finally reflect real capacity.
That reduces the gap between what the planning system promises and what the plant can physically deliver.
Maintenance Decisions Improve
Reason-coded downtime tells maintenance teams which machine is failing, how it is failing and how often.
That provides a better basis for maintenance priorities than relying only on breakdown reports or operator memory. Pasted text
Customer Commitments Become More Defensible
Lead times can start coming from measurable capacity instead of experience and memory alone.
And once enough trustworthy history exists, AI can become useful for identifying patterns and supporting failure prediction.
But the order matters.
AI trained on a few weeks of unreliable reason codes will simply learn unreliable data confidently.
Get the production data trustworthy first. Add intelligence later. Pasted text
What This Has Looked Like in Delivery
Accucia has built manufacturing systems for Star Engineering and Force Motors in India.
According to the supplied material, a recurring challenge in these environments was not software development itself. It was agreeing on what constituted a stoppage and establishing responsibility for recording it.
The same data principle appeared in Accucia's quotation-automation work for Utech Waterproofing. There, quotation delays were driven by scattered inputs rather than complicated quotation logic.
The broader lesson is the same:
Fix the point where data is created, and many downstream software problems become easier to solve. Pasted text
Across eight years, 730+ projects and 25+ industry verticals, the supplied material says the manufacturing implementations that gained value from production tracking were those that treated downtime reason codes as a management decision rather than merely an IT configuration exercise. Pasted text
Accucia's View
If you operate three machines on one shift, you may not need OEE software.
A whiteboard, clipboard and disciplined supervisor can potentially provide enough visibility at that scale.
According to Accucia's view in the supplied material, software begins to earn its place somewhere around 15 machines, or sooner when multiple shifts create information gaps during handovers. Pasted text
We also think machine integration is sometimes oversold.
Reading PLC tags is the right answer on a modern production line. But many factories operate mixed equipment purchased across decades.
In that environment, operator entry can provide a significant portion of the early value while machine integrations are introduced progressively.
Most importantly, do not set an OEE target before you have enough trustworthy history to understand your baseline.
Otherwise, every conversation about improving the machine turns into an argument about whether the number itself is correct.
Get the number honest first.
Frequently Asked Questions
What is OEE?
OEE, or Overall Equipment Effectiveness, combines availability, performance and quality into one figure.
It measures how much of your planned production time actually produced good parts at the expected speed.
A machine can appear busy and still have poor OEE because the calculation includes slow running and rejected production, not simply operating hours. Pasted text
How Do You Calculate OEE?
Multiply:
Availability × Performance × Quality
Availability is run time divided by planned production time.
Performance is ideal cycle time multiplied by total count, divided by run time.
Quality is good count divided by total count.
You can also calculate OEE directly as:
Good Count × Ideal Cycle Time ÷ Planned Production Time. Pasted text
What Is a Good OEE Score?
The source cites Vorne's OEE.com reference, which describes around 60% as fairly typical for discrete manufacturers and 85% as world-class, with the latter built from 90% availability, 95% performance and 99% quality.
However, improving your own consistent trend is more useful than blindly chasing an external benchmark because definitions and operating conditions vary between plants. Pasted text
Why Can't My ERP Calculate OEE?
ERP usually records planned and booked production information: work orders, issued materials, labour and confirmed quantities.
It normally does not see short jams, speed losses or changeovers that overrun unless those events are captured elsewhere and fed back into the ERP. Pasted text
Do I Need an MES to Track OEE?
No.
MES covers a much broader set of manufacturing processes. Basic OEE tracking needs comparatively little: machine state, part counts, rejects and downtime reason codes.
Many plants can begin with a tablet and counter before considering a larger MES implementation. Pasted text
What Is the Difference Between OEE and Machine Utilisation?
Utilisation generally measures how much of the available time a machine was running.
OEE goes further by accounting for speed losses and rejected production.
A machine can therefore have high utilisation while still producing a substantially lower OEE result. Pasted text
How Many Downtime Reason Codes Should We Start With?
Start with around six to ten.
Too many options encourage operators to choose the first plausible reason rather than the correct one.
Run the initial list for a month, identify categories collecting too much downtime, and then split those categories where additional detail would actually help. Pasted text
Should Operators Enter Downtime, or Should We Read the PLC?
Use both for different purposes.
Use the PLC or a counter for objective machine states and cycle counts.
Ask operators for the reason behind the event because that context may not be available from a sensor.
Avoid asking people to manually estimate durations that the machine or system could measure automatically. Pasted text
How Long Does an OEE Pilot Take?
The supplied material recommends planning approximately four to six weeks for one line and one shift.
Week one covers counter setup and reason-code definition.
Weeks two and three allow the plant to run the system and challenge the data.
Weeks four to six are used to stabilise the reason-code structure before expanding the rollout. Pasted text
Does OEE Work for Job Shops and Low-Volume Production?
Yes, but the priorities change.
For low-volume, high-mix manufacturing, changeover duration may be particularly important, while ideal cycle time can vary between jobs.
Track changeover duration and first-pass yield early, and compare performance with the routing standard for the specific job rather than using one fixed line rate. Pasted text
What Does OEE Software Cost?
There is no single figure in the supplied material.
Cost depends on machine count, available signals, the level of ERP integration, and the amount of work required to design and implement reason-code structures.
Plants with simple operator entry and counters will naturally have a different implementation scope from plants requiring extensive PLC and ERP integration. Pasted text
Can OEE Data Feed Our Existing ERP Without Replacing It?
Yes—and that should often be the objective.
Capture detailed events close to the machines and send agreed summaries back into the ERP, including confirmed good quantity, scrap by reason and downtime against the relevant work order.
An integration layer or MCP server can handle the mapping while keeping the ERP as the primary production system of record. Pasted text
Final Takeaway
Your ERP can tell you what production was planned, issued and booked.
It cannot tell you what happened during every minute between those events unless the shop floor captures that information.
That is where OEE and production tracking earn their place.
Start small. Capture downtime reasons. Measure actual cycles. Stabilise the definitions. Prove the numbers on one line and one shift.
Then integrate those numbers back into the ERP.
Because the goal is not another dashboard.
The goal is one production truth that the shop floor, planning team and management can all believe.
Turn Real Production Data Into Better Decisions.